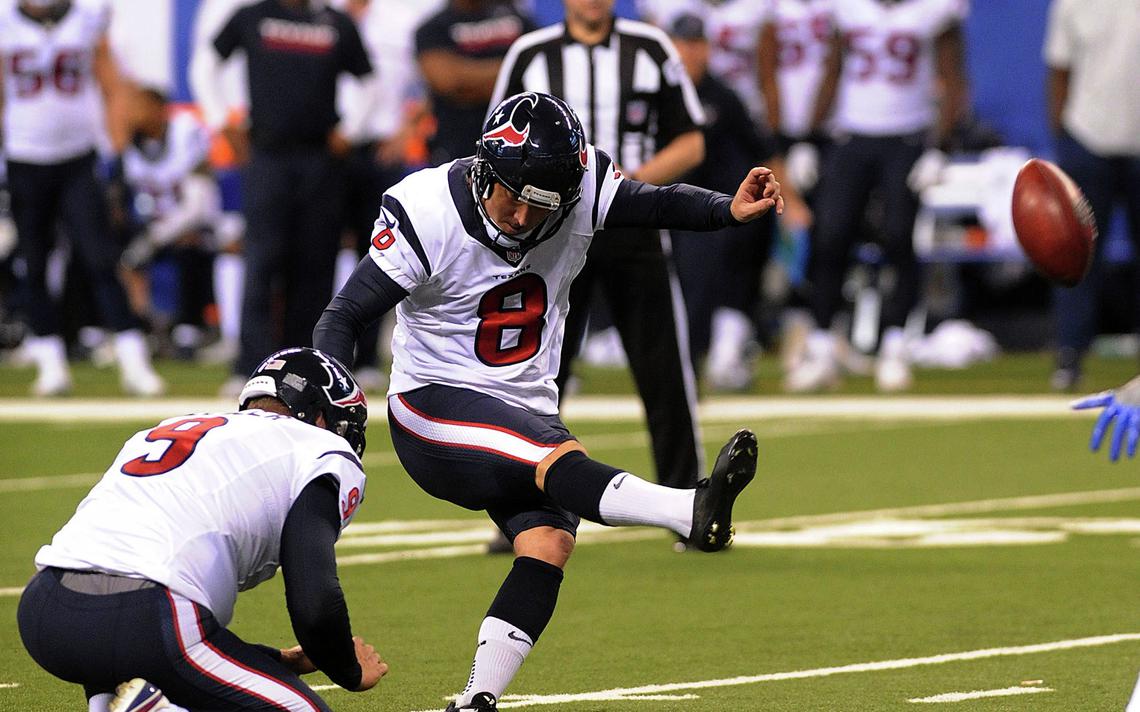
A little less than a year ago, I posted this article describing a metric called Expected Field Goal Percentage (xFG%). It only took one variable into account: distance. And it did so in the most elementary way possible, simply placing a field goal attempt into different categories (0-19 yards, 20-29 yards, 30-39 yards, 40-49 yards, 50+ yards). While it was certainly an improvement over traditional field goal percentage, there was a lot of room for improvement. Now, I’ve made that improvement.
Using a dataset consisting of 10,879 field goal attempts over the past 11 years, I sought to create a more complex model for field goal accuracy. The new model is composed of the following features:
And the label for the model is obviously whether or not the field goal attempt was successful. A snippet of the dataset looks like this:

The first three columns are just for identification purposes. The fourth column is the label of the model, and the rest are the features. The features are the inputs that are used to predict the label.
I trained an XGBoost machine learning model on a portion of the dataset (the training data) and then tested the model on the remaining data (the testing data). I calculated the accuracy score, Brier score, and AUC score in order to evaluate the model.
Accuracy: 0.8455882352941176
Brier: 0.11384989954855385
AUC: 0.7814352078200157
Of course, this isn’t the first attempt to model NFL field goal kicking. I used these values to compare the accuracy of my model to past models. This research paper by Pasteur and Cunningham-Rhoads created a model with a Brier score of 0.1226. A lower Brier score is better (because it is a loss function), so my model seemed to grade better in that regard. In this paper by Osborne and Levine, a model with an AUC of 0.7646. A higher AUC is better, so my model edged out their’s according to that evaluation. Finally, in this article from Jacob Long, a model with a Brier score of 0.1160 is achieved, which is worse than mine, as with the model’s AUC of 0.7811.
All things considered, I think most of these models are fairly similar in accuracy. The differences do not appear to be significant, but I’m satisfied with the fact that it’s even close at all.
With the new and improved xFG% model, I calculated every player’s cumulative xFG% and compared it with their FG% on kicks from 2009 to 2019. Here’s the full cumulative data. I also went ahead and applied the model to single-season performances, which you can check out here.
Here’s a plot with some of the noteworthy points (only players with at least 100 FGA were plotted).
That straight line is the expectation curve. A player on that line is perfectly average — their actual FG% is equal to their xFG%. Being above the line means a player outperforms expectation, while being below the line means they perform worse than expected. I think this visualization does a good job at demonstrating the value of this model. If the only way you evaluated players was with their actual field goal percentage, you would likely conclude that Shayne Graham was a better kicker than Sebastian Janikowski. Once you account for other variables, though, like the fact that an average Janikowski field goal attempt was over four yards longer than one from Graham (40.0 vs 35.6), you would see that Janikowski was actually considerably more effective.
There are a lot of external factors that impact a field goal. These are factors that are neglected when we just look at basic FG% to evaluate placekickers. New advanced metrics are constantly created in the sporting world in order to add more context to the evaluation of specific players. This is one of them. It’s a massively improved version of a very basic metric I created one year ago. And there’s still so many variables that are unaccounted for: wind direction relative to the direction of the kick, wind speed at the actual time of the kick, type of turf, etc. Maybe in 2021 we’ll be able to improve upon this version of xFG%.

That was a great article 🙂
Cheema does it again.